NACA 0012 aerodynamic validation
This study assesses FluxCore on the canonical NACA 0012 airfoil using the standard Spalart–Allmaras turbulence model. The case follows the NASA Turbulence Modeling Resource (TMR) benchmark at a freestream Mach number of 0.15 and chord Reynolds number of $6.0\times10^6$.
Download the original validation report
1. Introduction
The NACA 0012 airfoil is a standard benchmark for validating Reynolds-averaged Navier–Stokes (RANS) solvers and turbulence models. Its simple geometry and extensive experimental and numerical datasets allow predictions of aerodynamic forces, surface pressure and skin friction to be assessed under both attached and high-incidence flow conditions.
Simulations are performed at angles of attack of 0°, 10° and 15°. Predicted lift, drag, surface-pressure coefficient and skin-friction coefficient are compared with available experimental measurements and established CFD reference data. The NASA Family II, Level-4 grid is used because the aerodynamic coefficients and grid-convergence behaviour are sensitive to streamwise resolution near the sharp trailing edge.
2. Simulation setup
2.1 Geometry and computational mesh
The computational model uses the modified NACA 0012 profile supplied by the NASA TMR. The geometry is scaled to produce a sharp, closed trailing edge at $x/c=1$. The chord is $c=1$ m, the leading edge is at the origin and the $x$-axis follows the chord line.
The NASA TMR Family II, Level-4 structured C-grid contains 897 × 2 × 257 nodes, corresponding to 229,376 hexahedral cells. Its C-type topology wraps around the airfoil and reconnects in the wake. One cell is used in the spanwise direction, giving a quasi-two-dimensional domain. The farfield is approximately 500 chord lengths from the airfoil and the airfoil surface contains 512 boundary faces.
2.2 Flow conditions and physical models
Steady, fully turbulent RANS calculations use the standard Spalart–Allmaras model. Air is treated as an ideal gas with $\gamma=1.4$ and $R=287.058\ \mathrm{J,kg^{-1},K^{-1}}$. The freestream state is defined by:
Dynamic viscosity is evaluated with Sutherland’s law:
where $\mu_0=1.716\times10^{-5}$ Pa·s, $T_0=273.15$ K and $S=110.4$ K. Incidence is imposed in the $x$–$z$ plane:
The Spalart–Allmaras farfield condition is:
The airfoil is an adiabatic no-slip wall with low-Reynolds-number near-wall integration and no wall function. Characteristic farfield conditions are applied to the outer boundaries, with symmetry conditions on the two spanwise planes.
2.3 Numerical controls and convergence
The study uses FluxCore’s production second-order bounded spatial discretisation. Named implementation components are intentionally omitted from the public documentation, while the complete physical setup, mesh, convergence targets and comparison data are reported here.
The convergence targets for the normalised mean-flow and turbulence-model residuals are:
2.4 Complete simulation configuration
Category |
Setting |
Value or description |
|---|---|---|
Geometry |
Reference chord |
$c=1$ m |
Mesh |
Grid |
NASA Family II, Level 4; structured C-grid |
Mesh |
Resolution |
897 × 2 × 257 nodes; 229,376 hexahedral cells |
Flow |
Simulation type |
Steady, fully turbulent compressible RANS |
Flow |
Mach number |
$M_\infty=0.15$ |
Flow |
Chord Reynolds number |
$Re_c=6.0\times10^6$ |
Flow |
Temperature |
$T_\infty=300$ K |
Flow |
Velocity |
$U_\infty=52.0836$ m/s |
Flow |
Density |
$\rho_\infty=2.12649$ kg/m³ |
Flow |
Dynamic viscosity |
$\mu_\infty=1.84592\times10^{-5}$ Pa·s |
Flow |
Static pressure |
$p_\infty=1.83127\times10^5$ Pa |
Flow |
Angles of attack |
$\alpha=0°$, 10°, 15° |
Material |
Gas model |
Ideal gas; $\gamma=1.4$, $R=287.058$ J/(kg·K) |
Material |
Viscosity model |
Sutherland law |
Turbulence |
Model |
Standard Spalart–Allmaras; low-Reynolds-number wall treatment |
Turbulence |
Farfield condition |
$\tilde{\nu}\infty/\nu\infty=3$; $\mu_{t,\infty}/\mu_\infty=0.210438$ |
Boundary condition |
Airfoil |
Adiabatic no-slip wall; no wall function |
Boundary condition |
Outer boundary |
Characteristic farfield |
Boundary condition |
Spanwise planes |
Symmetry |
Spatial discretisation |
Reconstruction |
Second-order bounded reconstruction |
3. Results
Results are compared using chordwise coordinate $x/c$ and angle of attack $\alpha$. The pressure coefficient $C_p$, skin-friction coefficient $C_f$, lift coefficient $C_L$ and drag coefficient $C_D$ are nondimensionalised by the freestream dynamic pressure $q_\infty=\tfrac12\rho_\infty U_\infty^2$:
3.1 Angle of attack: 0°
At $\alpha=0°$, symmetry requires zero lift. FluxCore predicts $C_L=0$ and $C_D=0.00808$, matching Flow360 and lying within the spread of the reference solvers.
Code |
$\alpha$ |
$C_D$ |
$C_L$ |
|---|---|---|---|
CFL3D |
0° |
0.00819 |
0 |
FUN3D |
0° |
0.00812 |
0 |
NTS |
0° |
0.00813 |
0 |
JOE |
0° |
0.00812 |
0 |
SUMB |
0° |
0.00813 |
0 |
TURNS |
0° |
0.00830 |
0 |
CGNS |
0° |
0.00817 |
0 |
OVERFLOW |
0° |
0.00838 |
0 |
Flow360 |
0° |
0.00808 |
$-8.648\times10^{-7}$ |
FluxCore |
0° |
0.00808 |
0 |
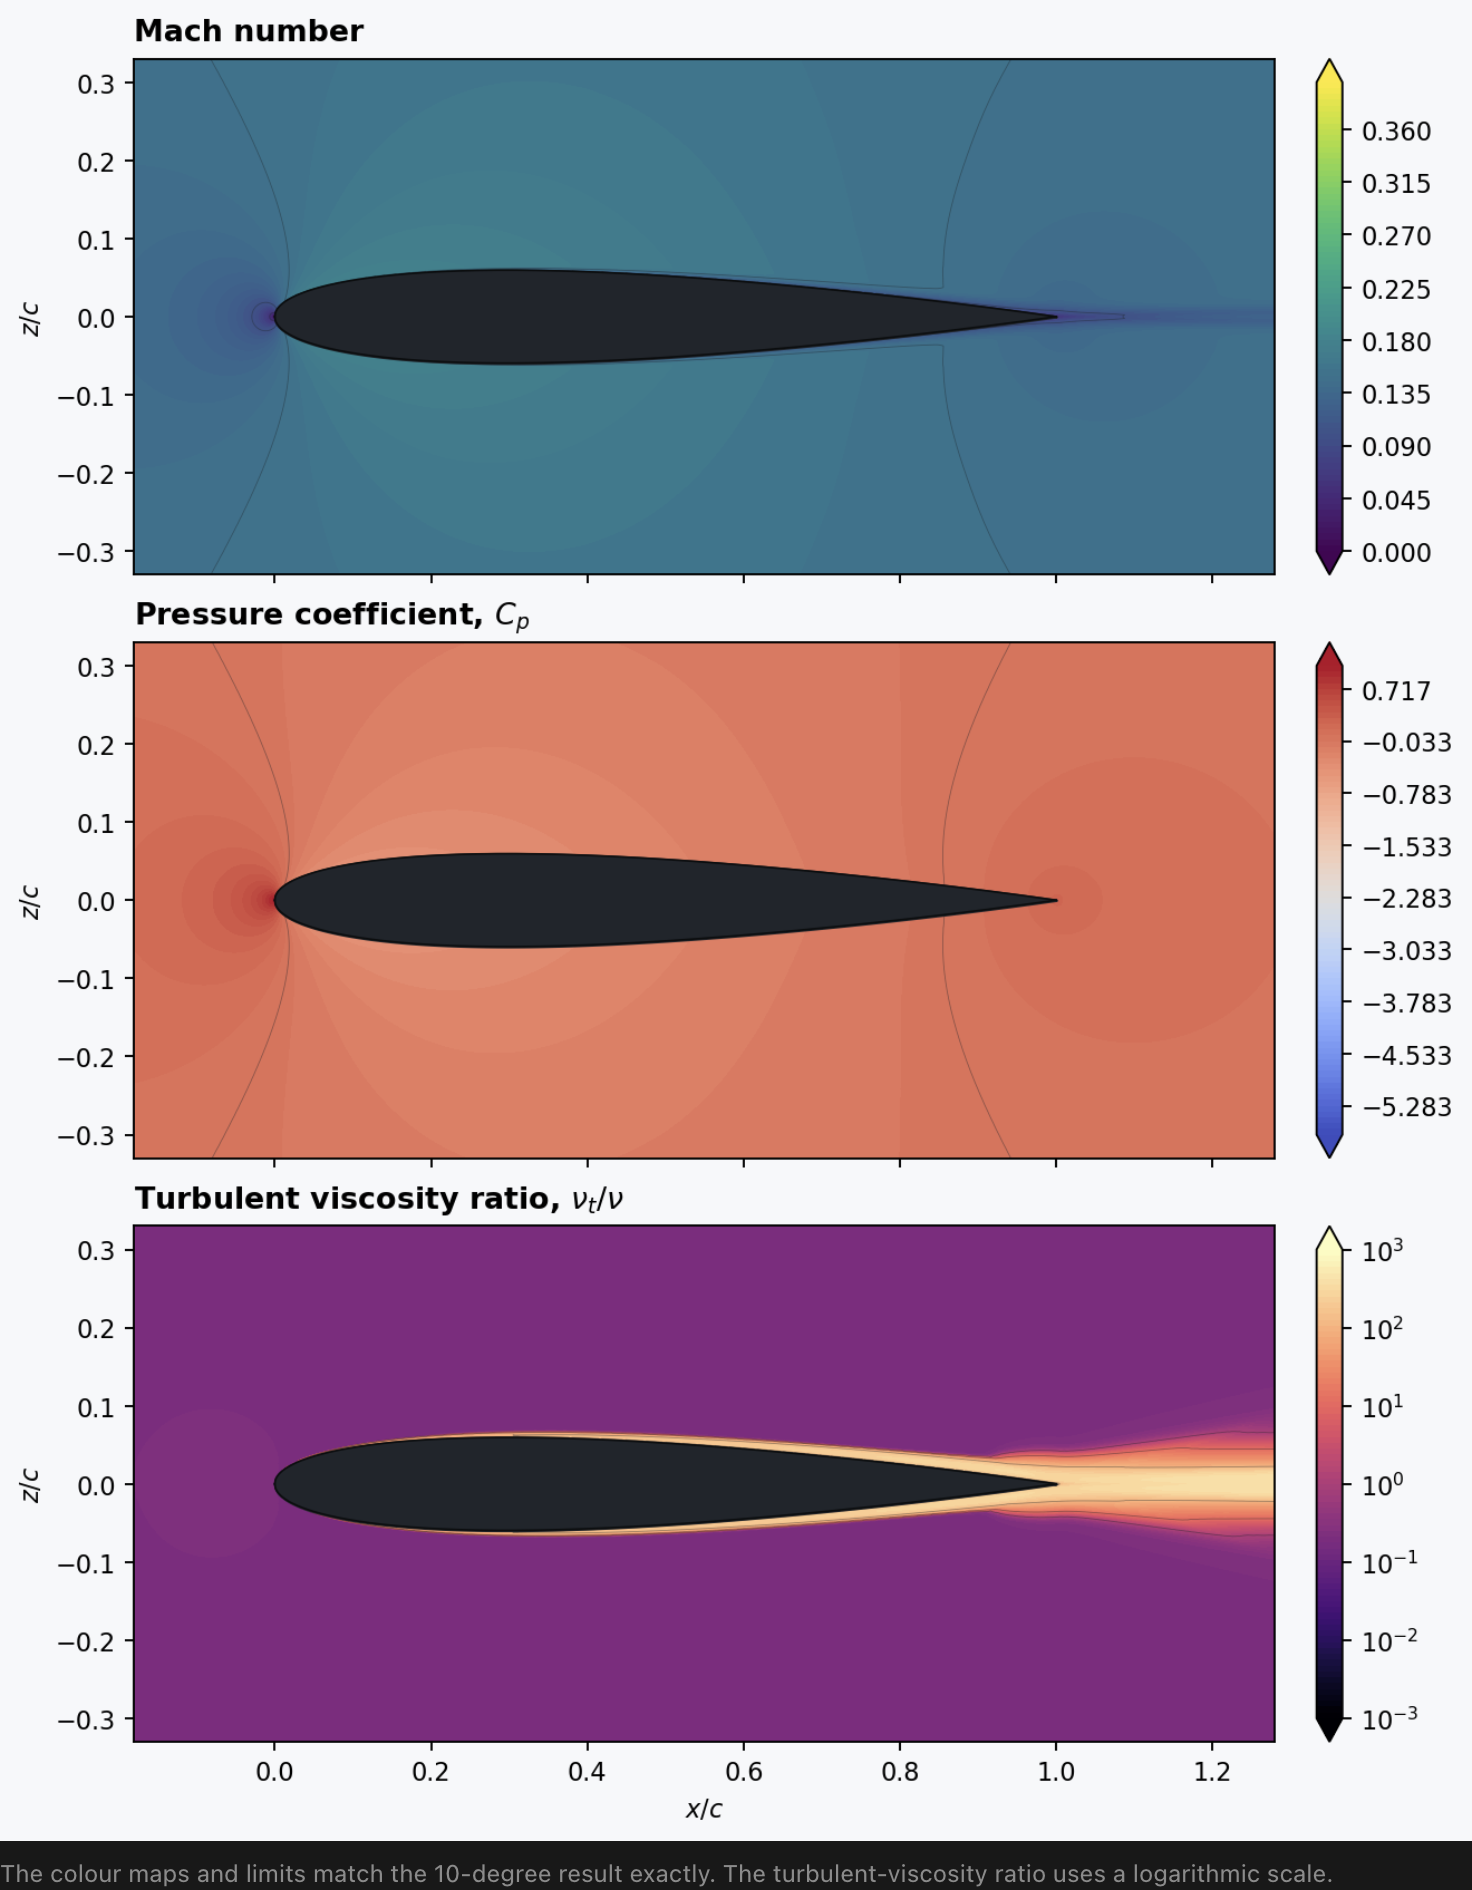
Figure 1. Mach number, pressure coefficient and turbulent-viscosity-ratio contours at $\alpha=0°$.
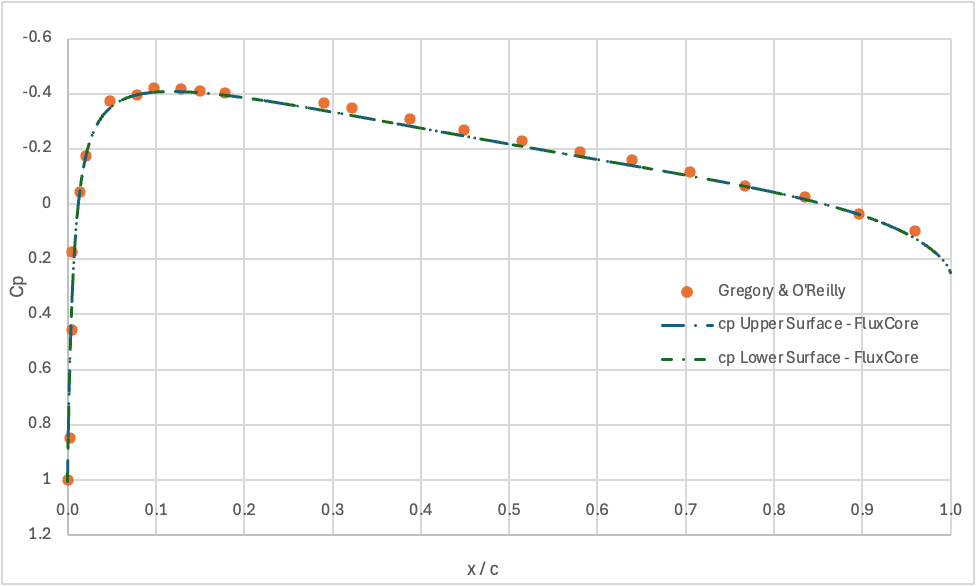
Figure 2. Surface pressure coefficient at $\alpha=0°$: FluxCore and Gregory and O’Reilly experimental measurements at $Re_c=2.88\times10^6$.
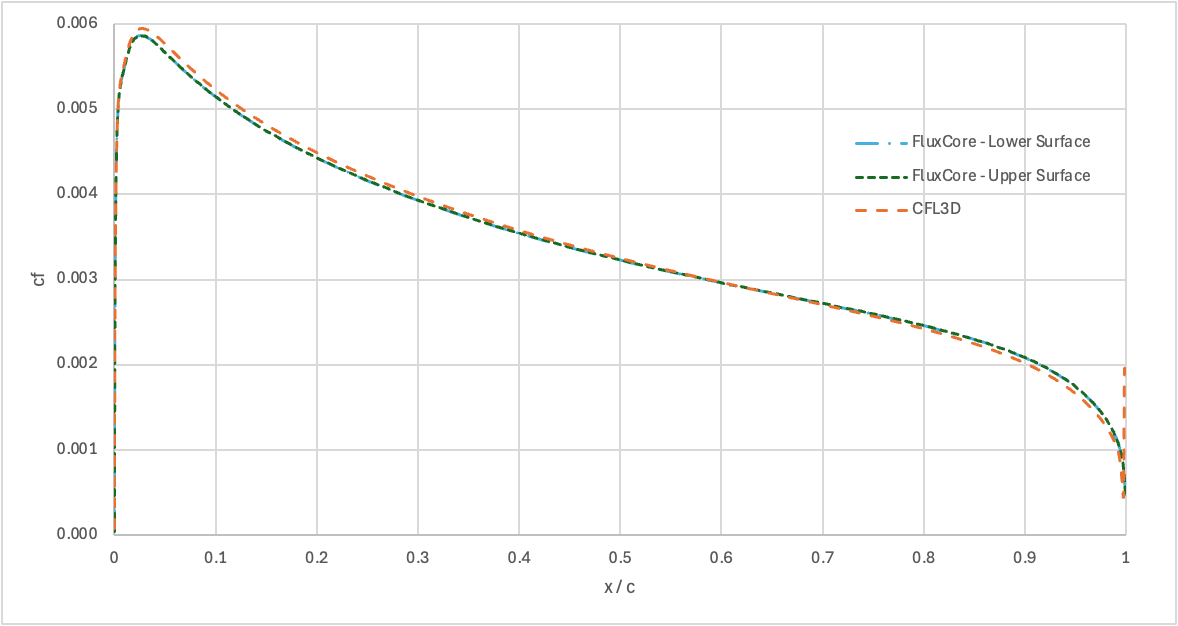
Figure 3. Surface skin-friction coefficient at $\alpha=0°$: FluxCore upper and lower surfaces and the CFL3D reference solution.
The flow-field contours and coincident upper- and lower-surface distributions confirm a symmetric attached solution. The computed pressure coefficient follows the Gregory and O’Reilly measurements over the chord, while $C_f$ varies smoothly to the trailing edge.
3.2 Angle of attack: 10°
At $\alpha=10°$, FluxCore predicts $C_L=1.0893$ and $C_D=0.01247$. These values closely match the Flow360 results, 1.0889 and 0.01244, and the wider reference set.
Code |
$\alpha$ |
$C_D$ |
$C_L$ |
|---|---|---|---|
CFL3D |
10° |
0.01231 |
1.0909 |
FUN3D |
10° |
0.01242 |
1.0983 |
NTS |
10° |
0.01243 |
1.0891 |
JOE |
10° |
0.01245 |
1.0918 |
SUMB |
10° |
0.01233 |
1.0904 |
TURNS |
10° |
0.01230 |
1.1000 |
CGNS |
10° |
0.01255 |
1.0941 |
OVERFLOW |
10° |
0.01251 |
1.0990 |
Flow360 |
10° |
0.01244 |
1.0889 |
FluxCore |
10° |
0.01247 |
1.0893 |
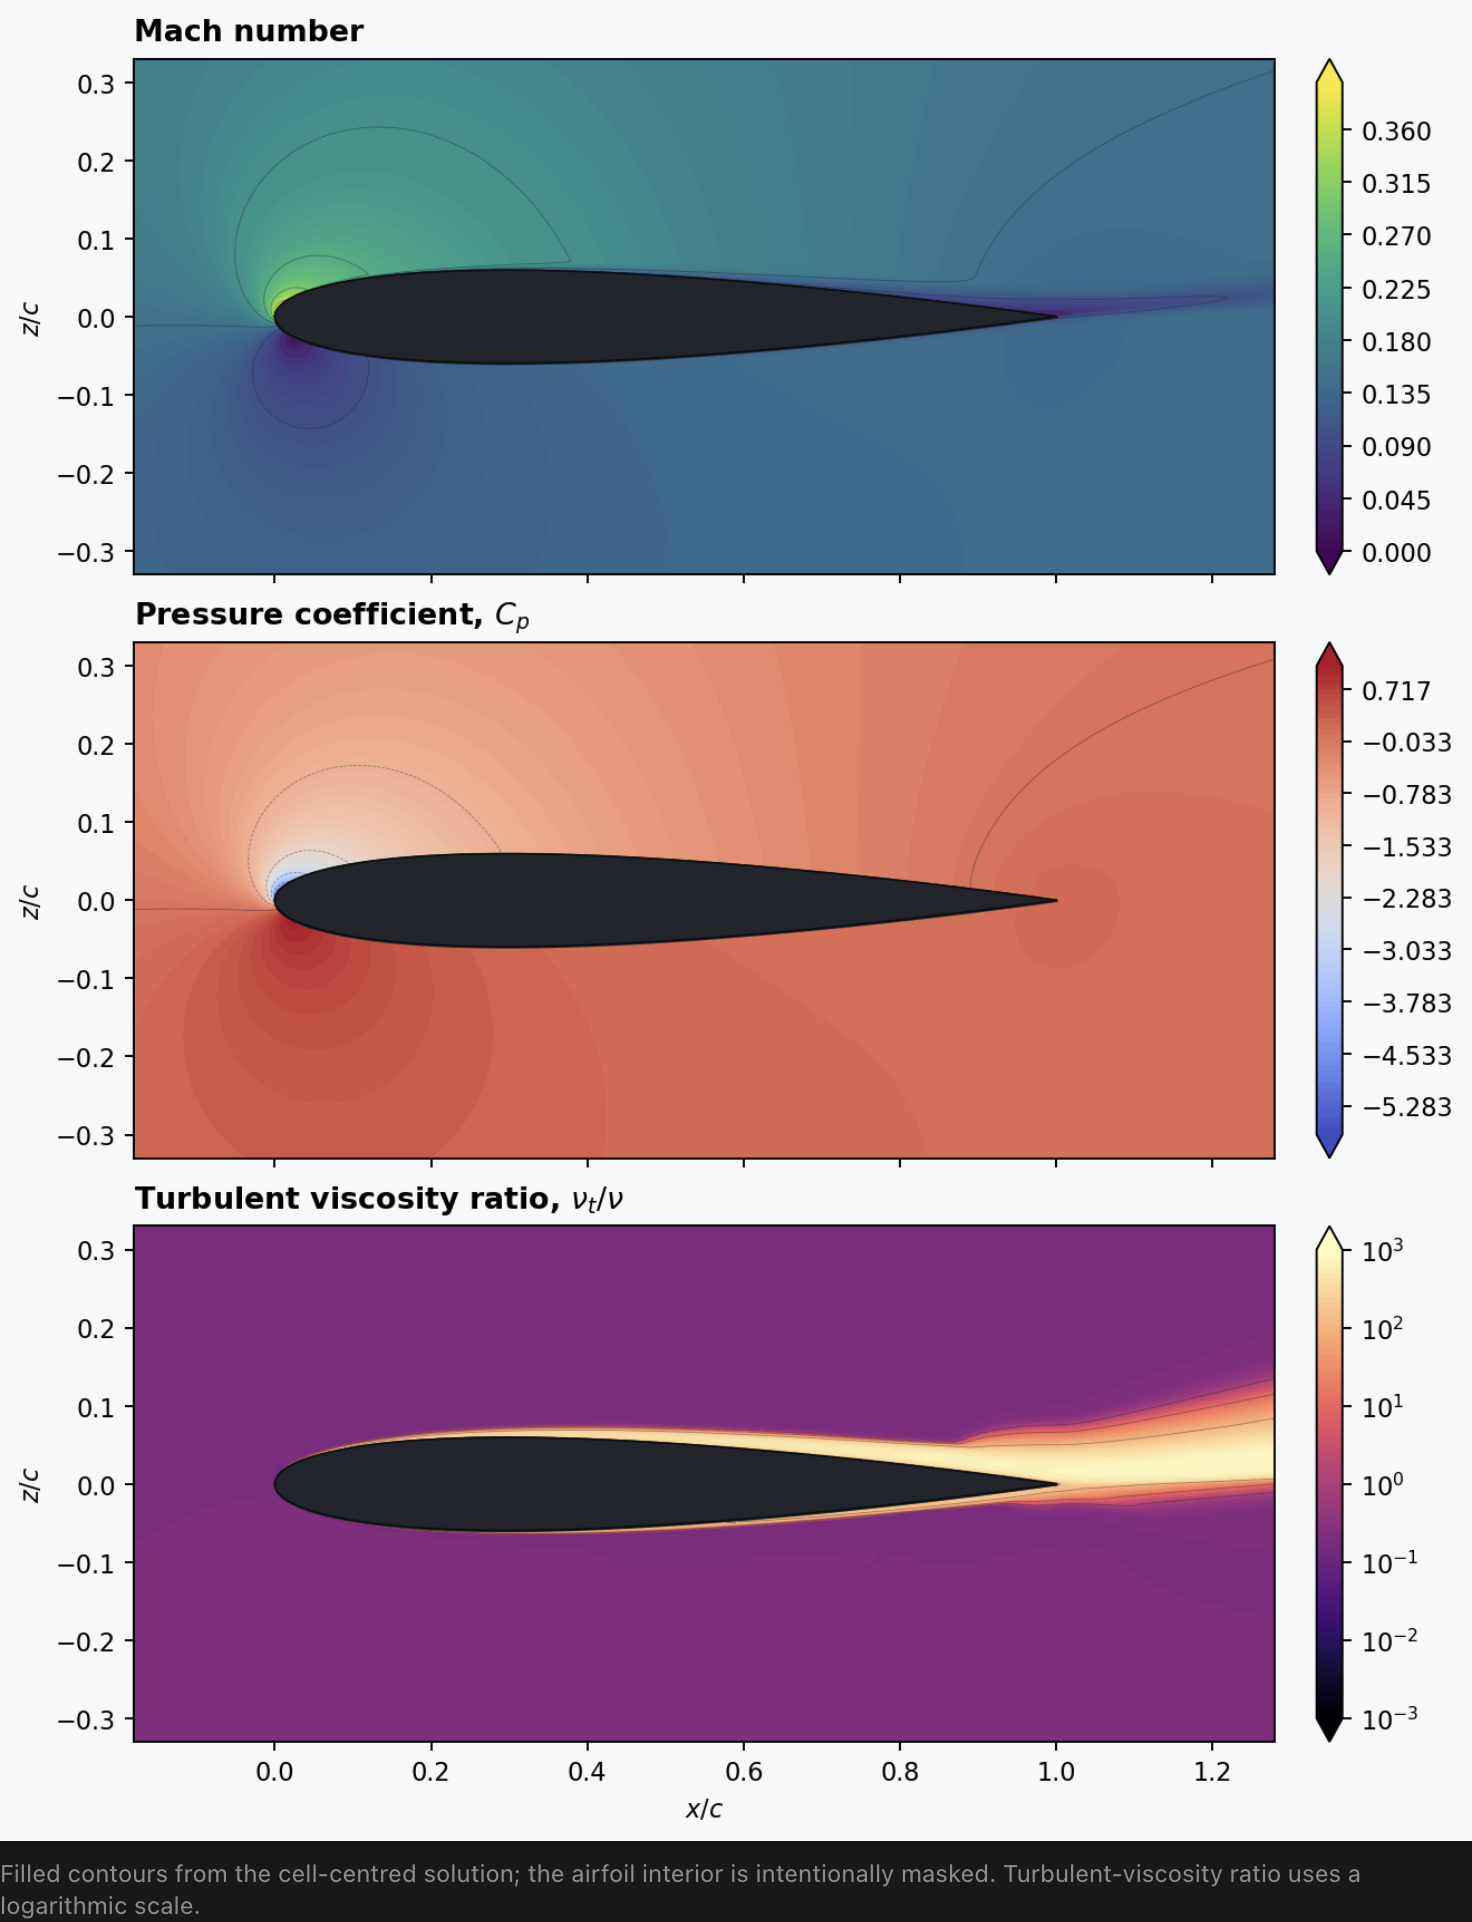
Figure 4. Mach number, pressure coefficient and turbulent-viscosity-ratio contours at $\alpha=10°$.
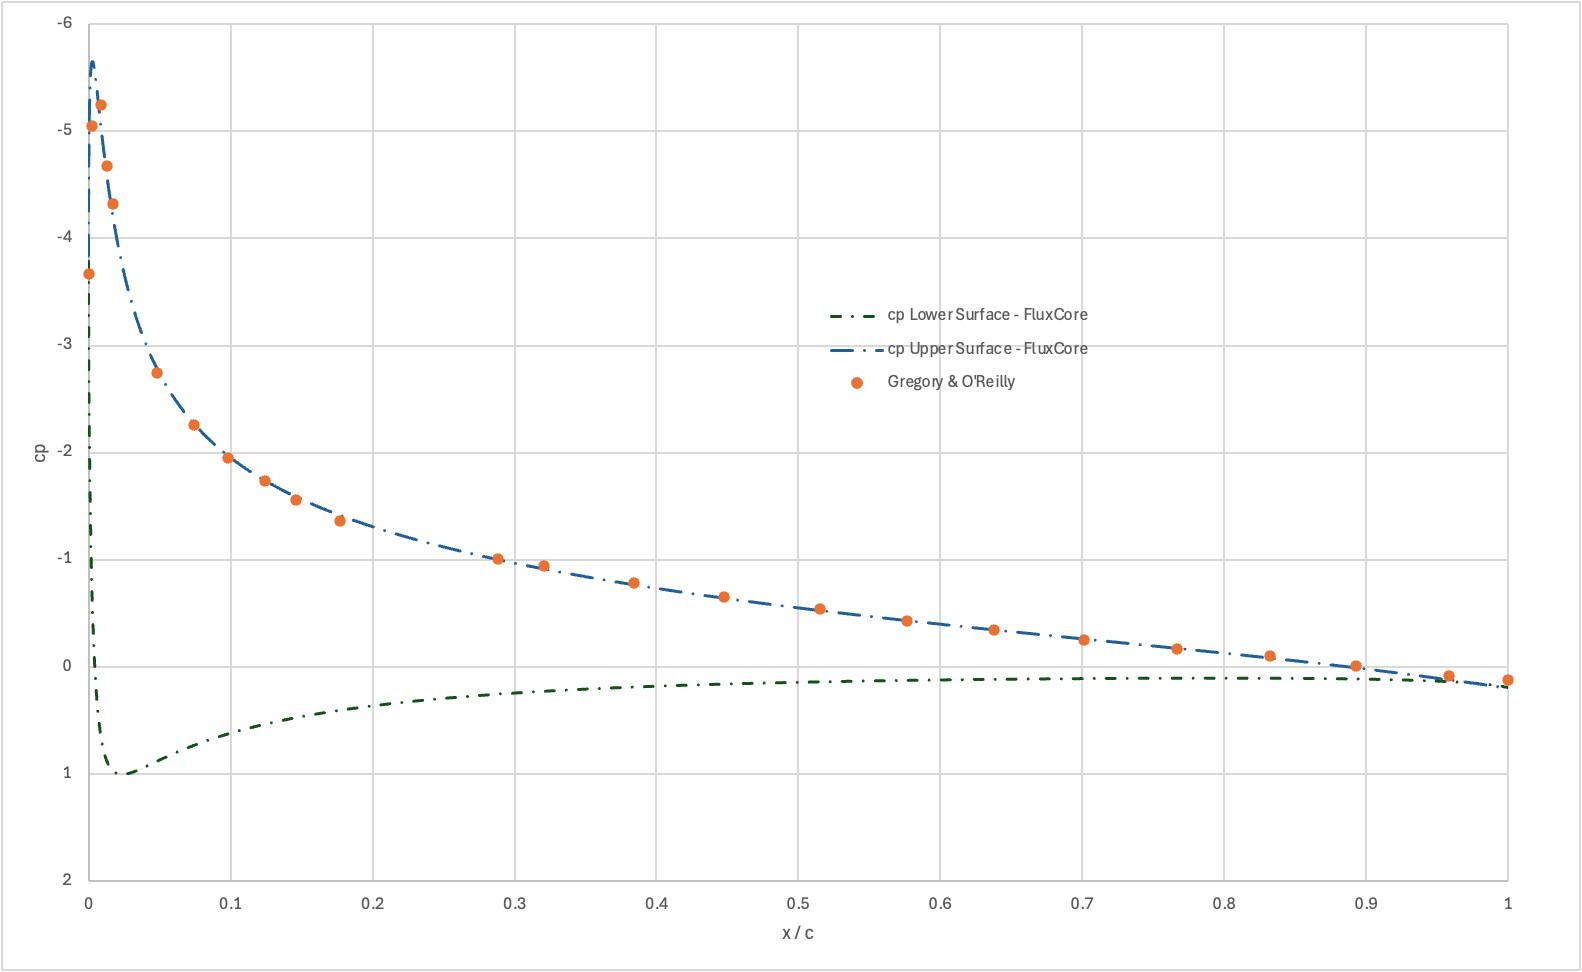
Figure 5. Surface pressure coefficient at $\alpha=10°$: FluxCore and Gregory and O’Reilly experimental measurements at $Re_c=2.88\times10^6$.
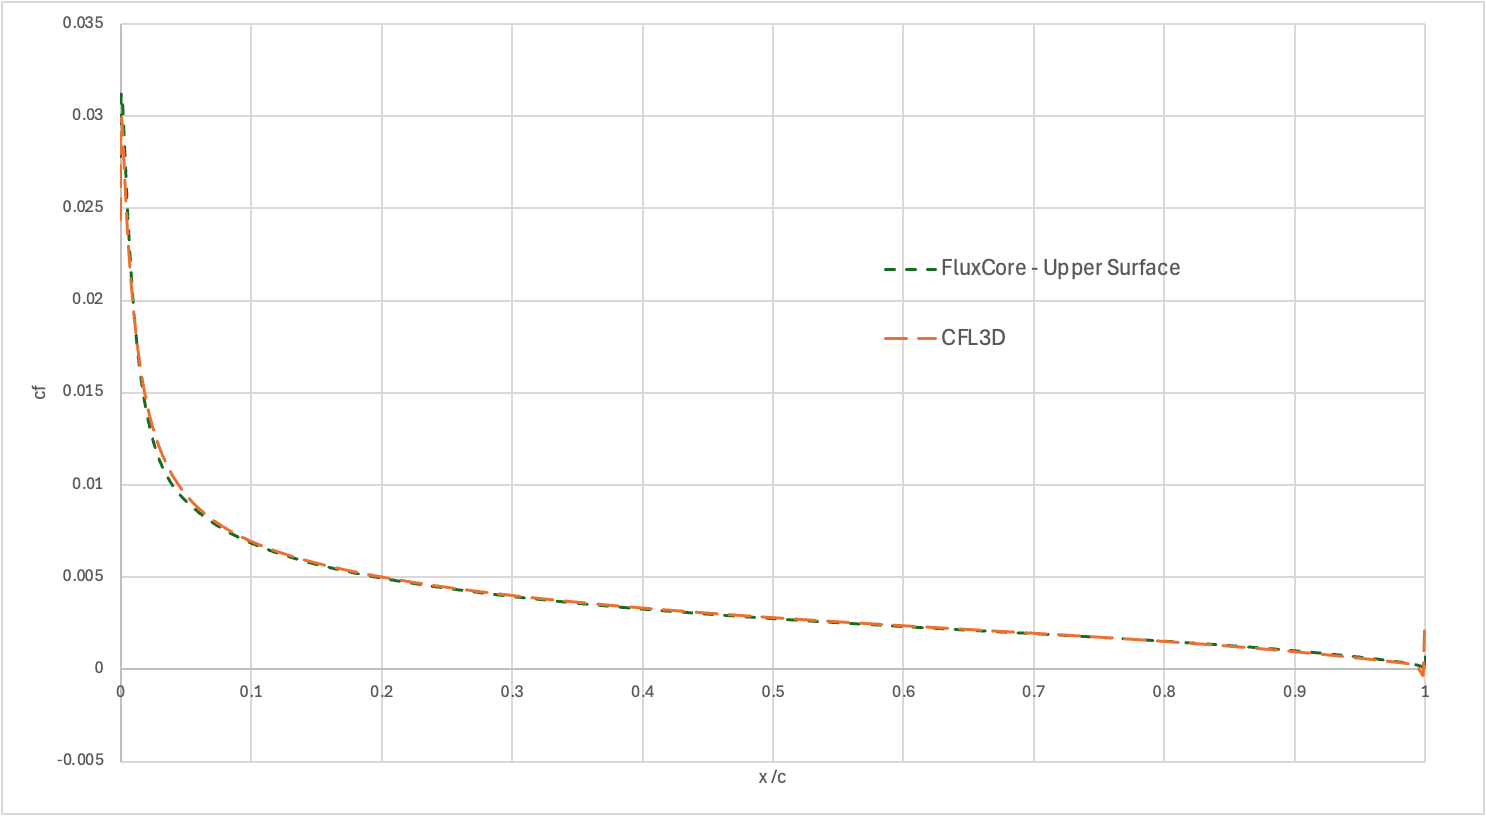
Figure 6. Surface skin-friction coefficient at $\alpha=10°$: FluxCore and the CFL3D reference solution.
The increased incidence produces a strong leading-edge suction peak and a thicker wake. FluxCore captures the measured pressure recovery, and the positive, smoothly decaying upper-surface $C_f$ indicates that the mean flow remains attached.
3.3 Angle of attack: 15°
At $\alpha=15°$, FluxCore predicts $C_L=1.5451$ and $C_D=0.02153$. Both coefficients lie within the reference-solver range and differ from the Flow360 values by less than 0.5%.
Code |
$\alpha$ |
$C_D$ |
$C_L$ |
|---|---|---|---|
CFL3D |
15° |
0.02124 |
1.5461 |
FUN3D |
15° |
0.02159 |
1.5547 |
NTS |
15° |
0.02105 |
1.5461 |
JOE |
15° |
0.02148 |
1.5490 |
SUMB |
15° |
0.02141 |
1.5546 |
TURNS |
15° |
0.02140 |
1.5643 |
CGNS |
15° |
0.02073 |
1.5576 |
OVERFLOW |
15° |
0.02149 |
1.5576 |
Flow360 |
15° |
0.02158 |
1.5381 |
FluxCore |
15° |
0.02153 |
1.5451 |
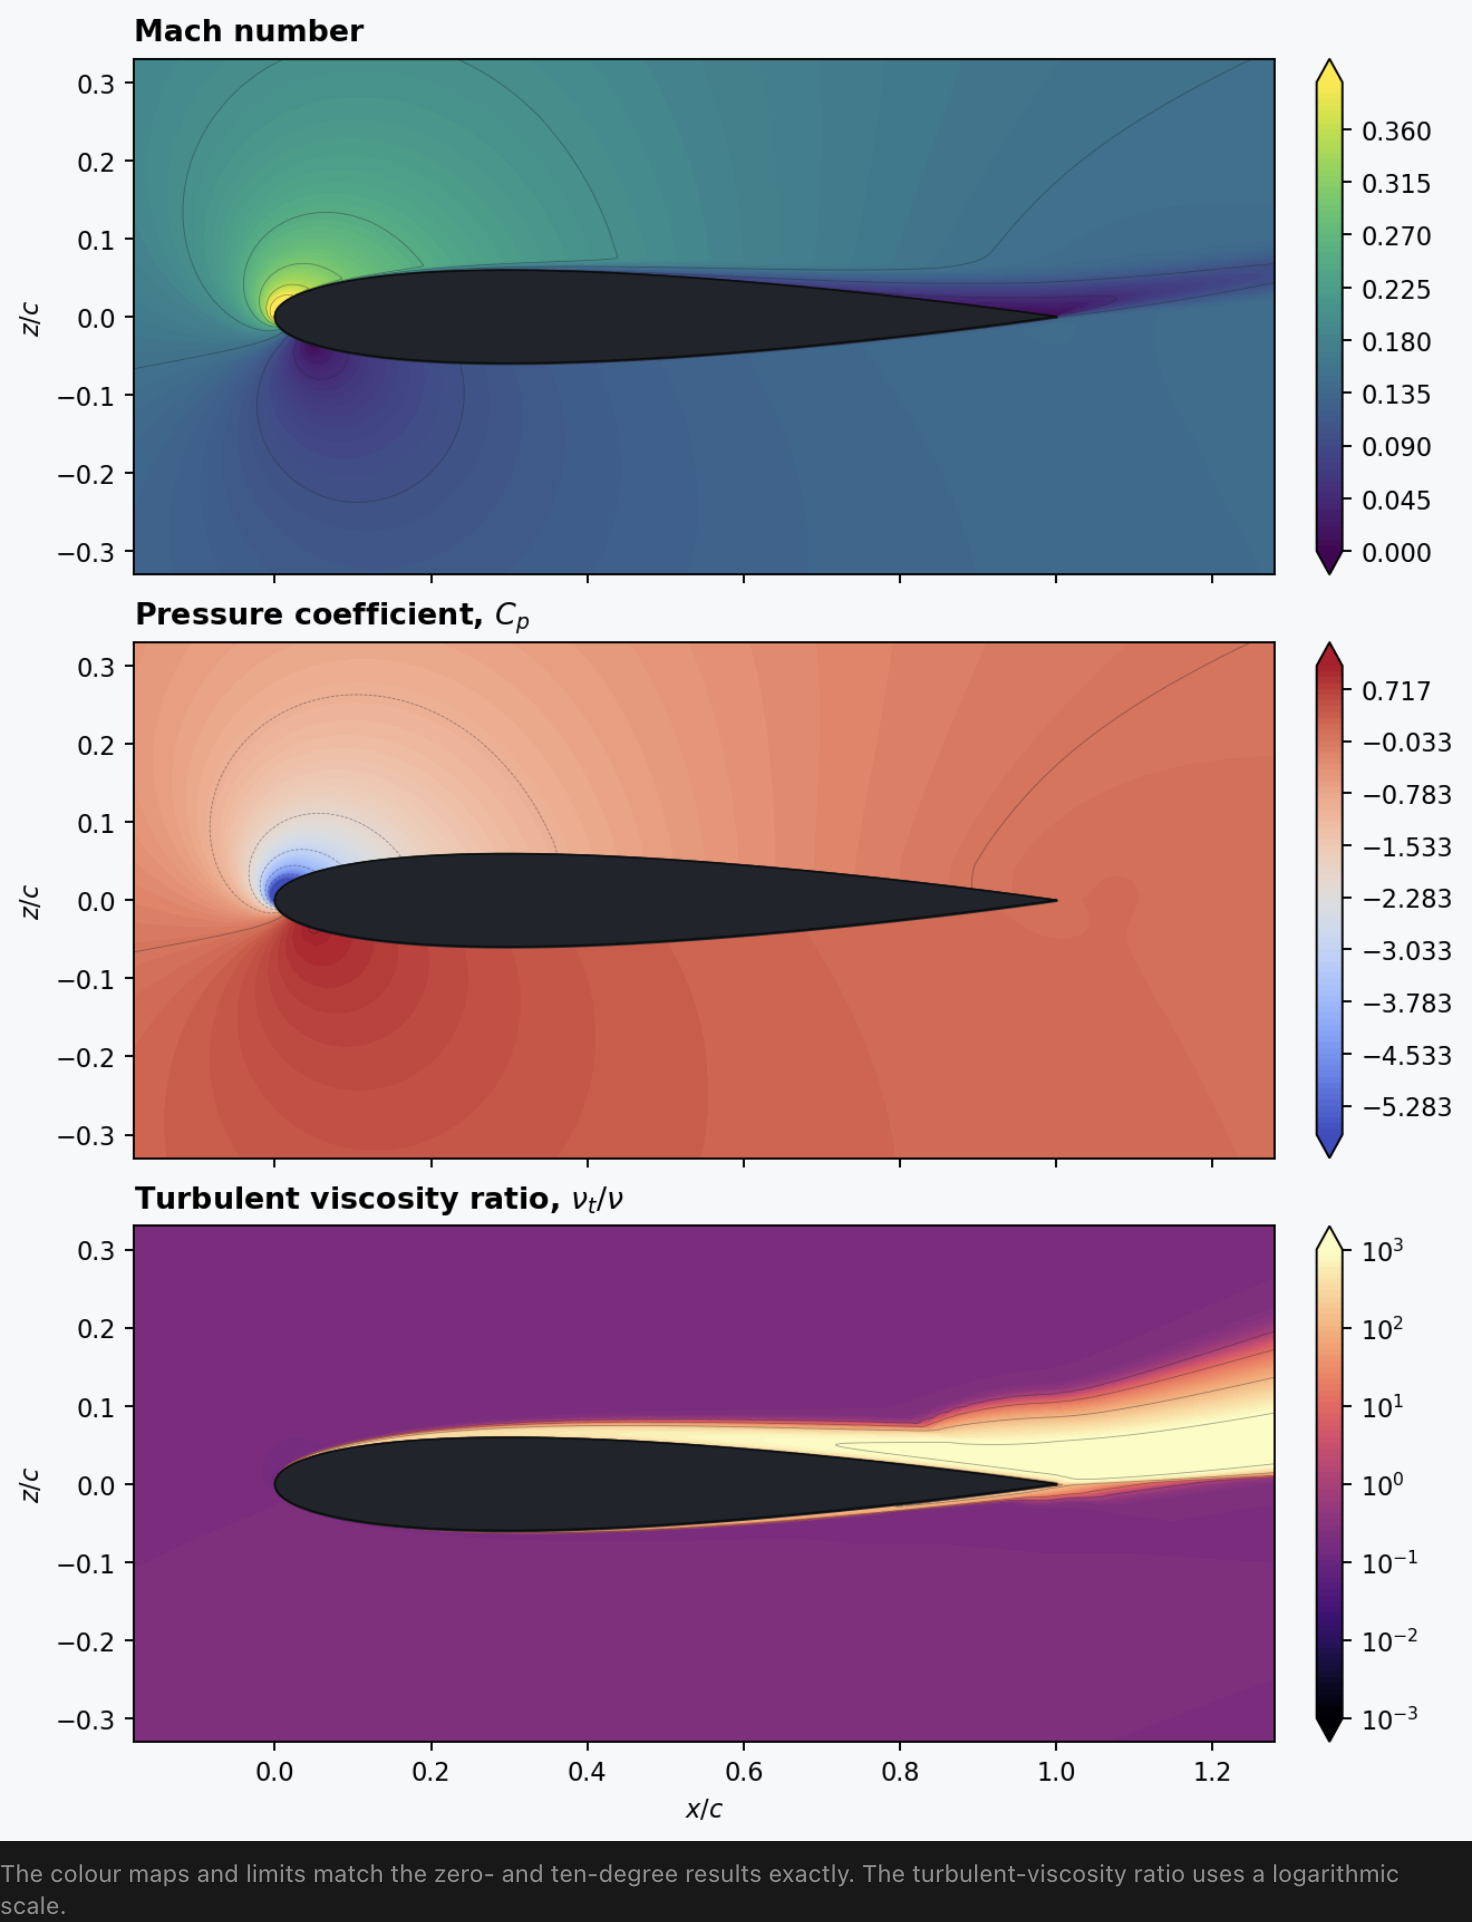
Figure 7. Mach number, pressure coefficient and turbulent-viscosity-ratio contours at $\alpha=15°$.
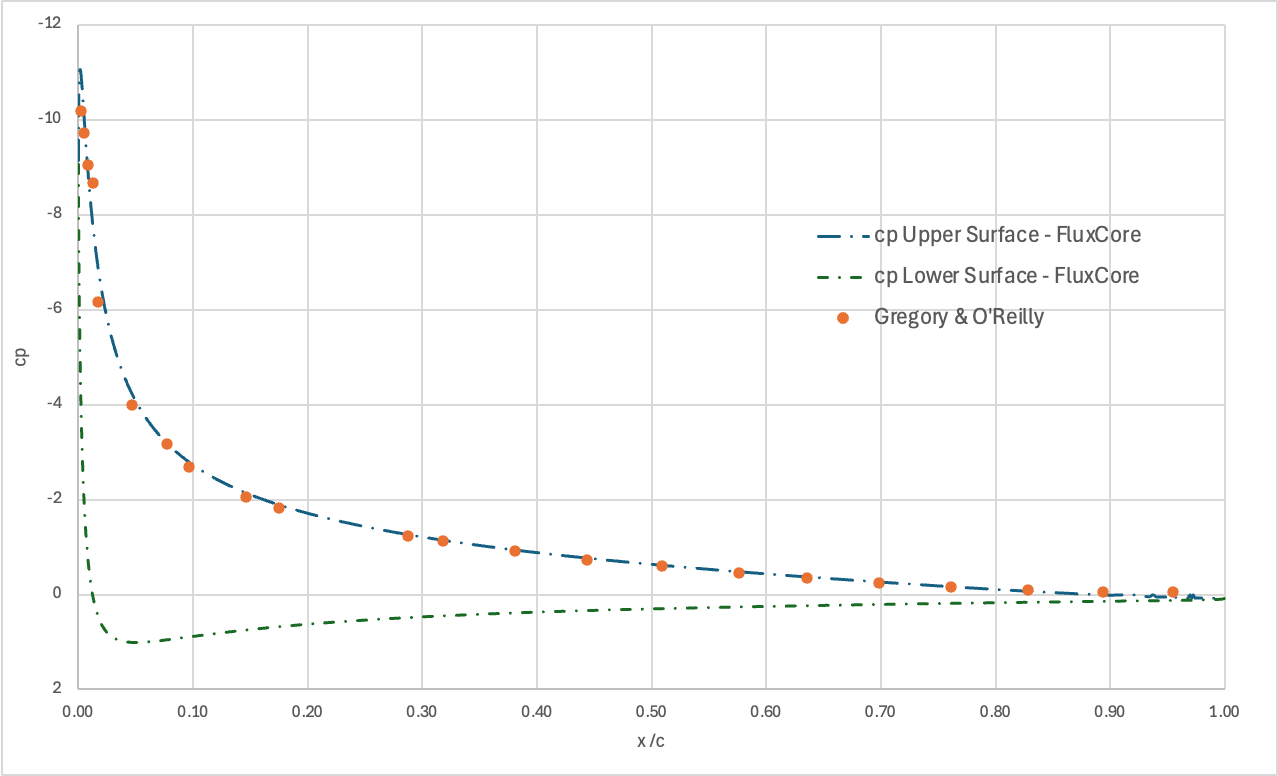
Figure 8. Surface pressure coefficient at $\alpha=15°$: FluxCore and Gregory and O’Reilly experimental measurements at $Re_c=2.88\times10^6$.
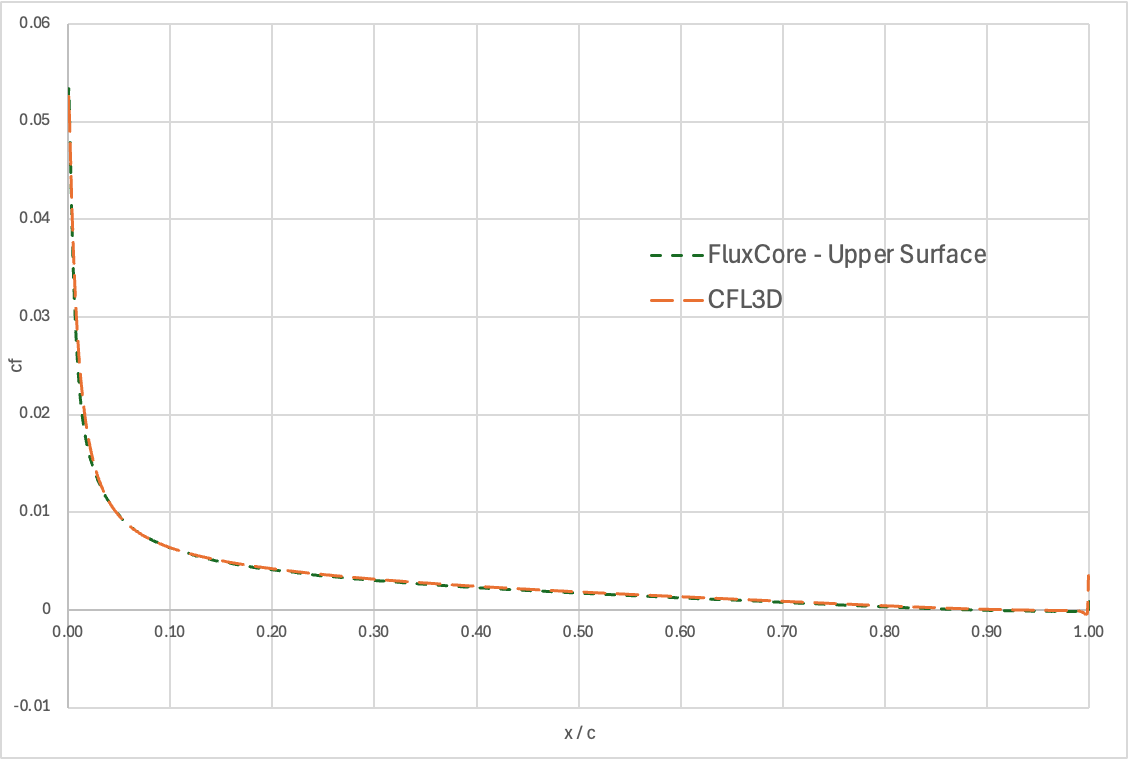
Figure 9. Upper-surface skin-friction coefficient at $\alpha=15°$: FluxCore and the CFL3D reference solution.
The suction-side pressure loading increases further at 15°. The upper-surface $C_f$ falls towards zero near the trailing edge, consistent with incipient trailing-edge separation and the behaviour reported in the Flow360 and NASA TMR studies.
4. Summary
Across $\alpha=0°$, 10° and 15°, FluxCore reproduces the established NACA 0012 force-coefficient trends and remains within the spread of the reference CFD solutions. The surface $C_p$ distributions follow the Gregory and O’Reilly measurements, while the $C_f$ results recover the expected progression from symmetric attached flow to incipient upper-surface separation at 15°. The lift curve also agrees closely with Ladson’s tripped experimental data.
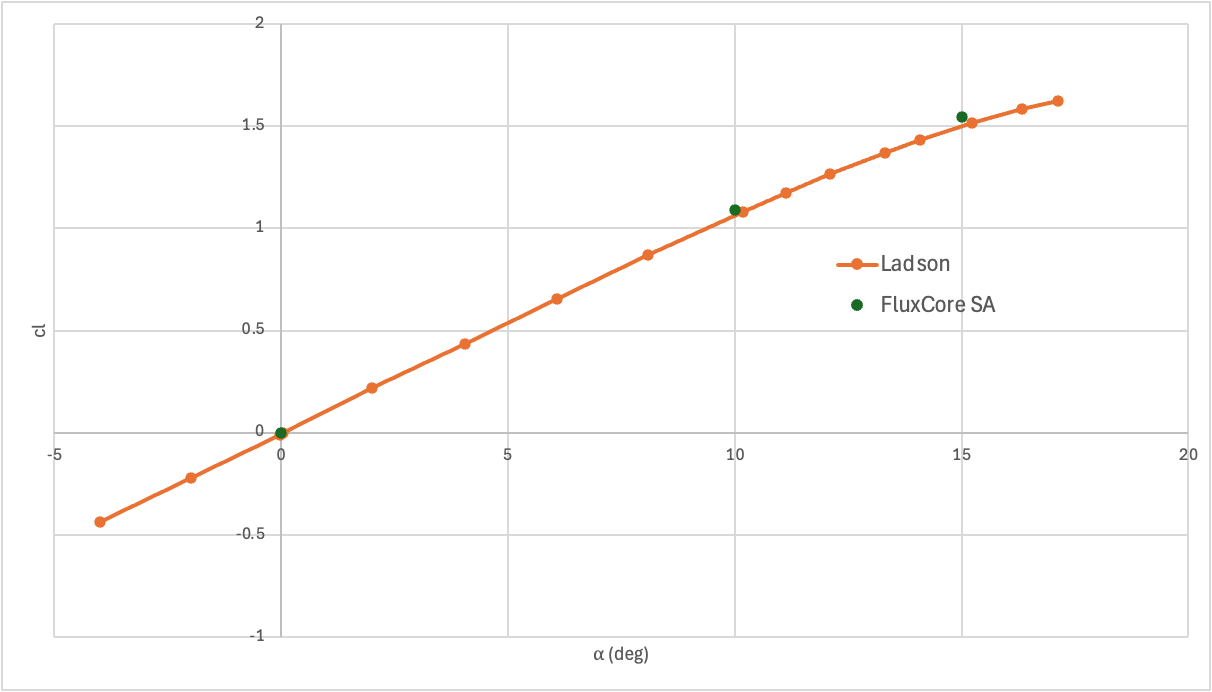
Figure 10. Lift coefficient versus angle of attack: FluxCore and Ladson’s tripped experimental measurements at $Re_c=6.0\times10^6$.
Differences at high incidence should be interpreted in the context of experimental Reynolds-number differences and the increasing difficulty of maintaining two-dimensional flow near stall. Overall, the results support the compressible RANS and standard Spalart–Allmaras implementation in FluxCore for this benchmark.
References
Flexcompute Inc. Flow360: NACA 0012 Low Speed Airfoil validation study.
NASA Langley Research Center. 2D NACA 0012 Airfoil Validation Case, Turbulence Modeling Resource.
Gregory, N. and O’Reilly, C. L. (1970). Low-Speed Aerodynamic Characteristics of NACA 0012 Aerofoil Section, including the Effects of Upper-Surface Roughness Simulating Hoar Frost. Reports and Memoranda No. 3726.
Ladson, C. L. (1988). Effects of Independent Variation of Mach and Reynolds Numbers on the Low-Speed Aerodynamic Characteristics of the NACA 0012 Airfoil Section. NASA TM-4074.